
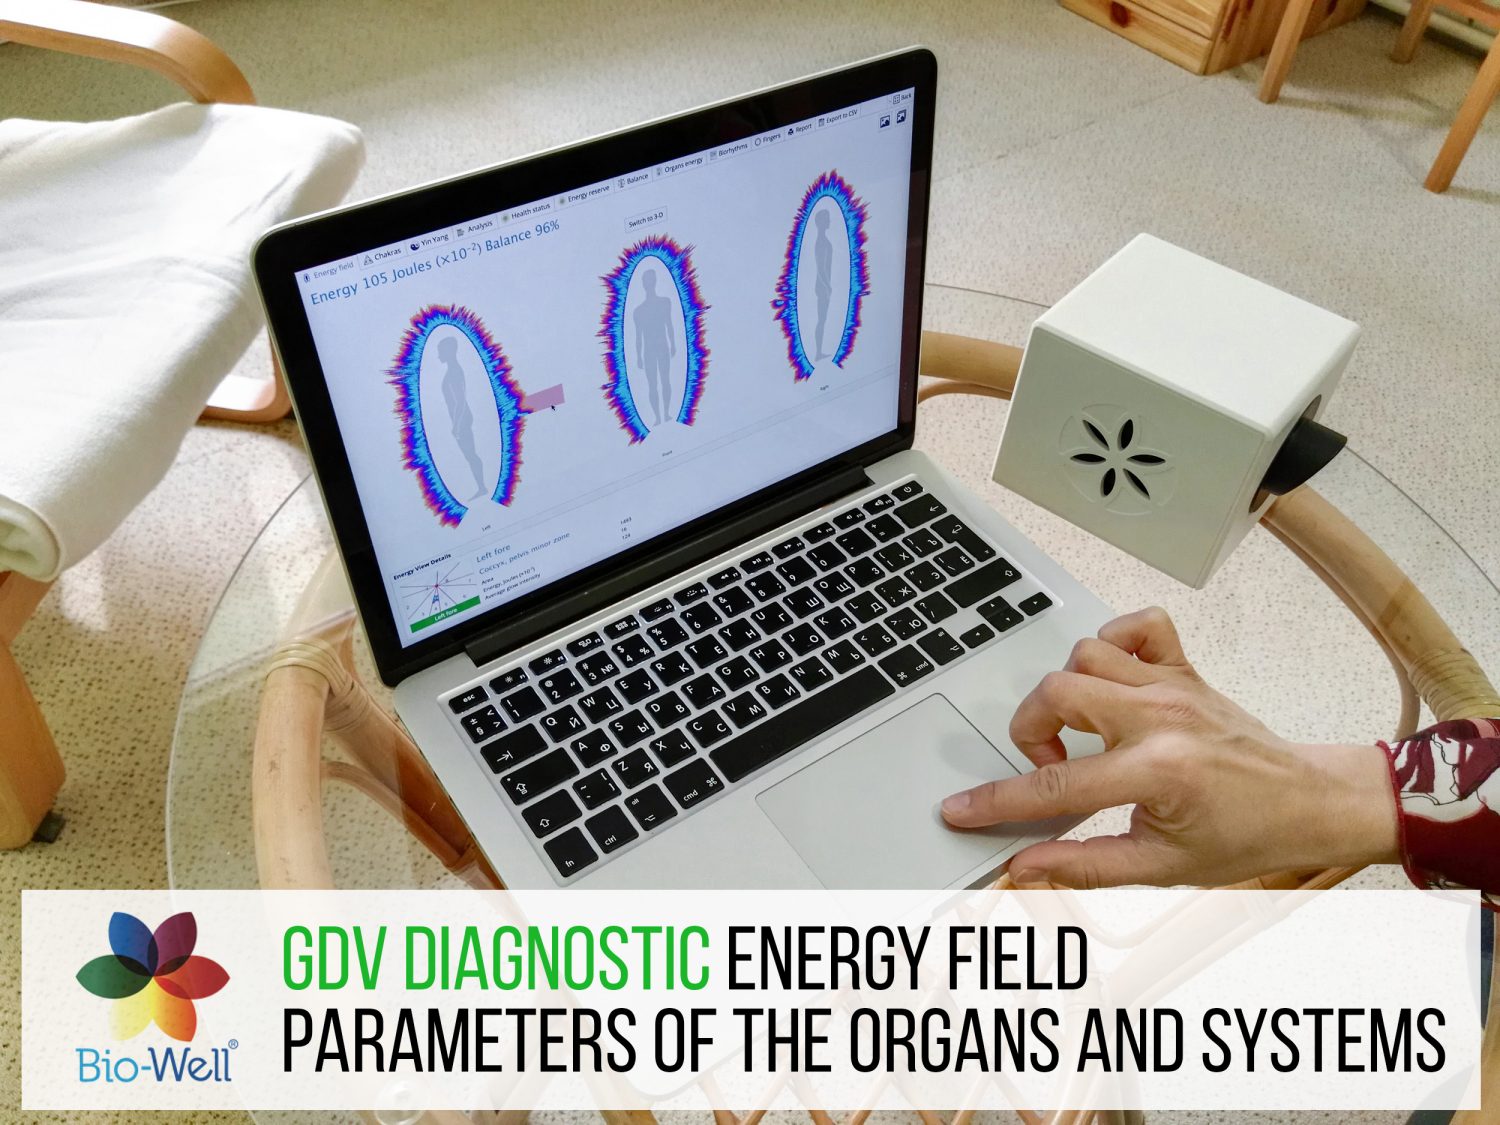
Gas Discharge Visualization Technique (GDV) is computer registration and analysis of gas discharge glow (Korotkov’s images) of any biological objects placed in a high intensity electromagnetic field
GDV ELECTROPHOTONIC SCIENTIFIC BASIS
What does the GDV method measure in physical terms?
The GDV method is based on the stimulation of photon and electron emissions from the surface of the object whilst transmitting short electrical pulses. In other words, when the object is placed in an electromagnetic field, it is primarily electrons, and to a certain degree photons, which are ‘extracted’ from the surface of the object. This process is called ‘photo-electron emissions’ and it has been quite well studied with physical electronic methods. The emitted particles accelerate in the electromagnetic field, generating electronic avalanches on the surface of the dielectric (glass). This process is called ‘sliding gas discharge’. The discharge causes glow due to the excitement of molecules in the surrounding gas, and this glow is what is being measured by the GDV method. Therefore, voltage pulses stimulate optoelectronic emission whilst intensifying this emission in the gas discharge, owing to the electric field created.
Can this emission take place without an electric field?
Yes, it can, and such an emission is called ‘spontaneous’. Measuring a spontaneous emission of electrons in the air is nearly impossible – it can only be done in a vacuum, and the spontaneous emission of photons is measured with the aid of a highly sensitive photomultiplier. This emission was measured for the first time by Professor Aleksandr Gurvich in the 1930s, and he proved that the exchange of ultraviolet photons is the method used by biological systems to regulate information. Currently, the area called ‘biophotonics’ is researching extremely weak photon emissions from biological objects. Much of the research done has shown that photons are emitted by any biological object: plants [Kobayashi, 2003], blood [Voeikov, 2001], water [Voeikov, 2001], human skin [Cohen, Popp, 1998]. When this happens, the quantity of photons emitted by the human head in a relaxed state and during meditation varies, and these variations are statistically reliable [Van Wijk, et al, 2005]!
Therefore, it has been categorically proven that all biological objects emit photons, and these photons participate in the processes of physiological regulation, and most importantly in the oxidising (oxidizing in USA) restorative chain reactions. In other words, all biological objects, including humans, are glowing both day and night!
Biological life depends on the use of energy of photons from the sun. This energy is then converted into electron energy and as a result, a series of transformations in complex chains of albuminous molecules are converted into our body energy. So it can be said that biological life is based on light energy, and organic compounds serve as the working material for the conversion of this energy. The basic ingredients for all conversions are water and air [Korotkov et al., 2004].
Consequently, we are all children of the Sun, living on the light of the world, and we ourselves emit light!
Yet the registration of ‘biophotons’ – spontaneous photo-emission – is an extremely complex procedure requiring special conditions, the most important of which is total darkness. Until the measurement begins, those being tested should spend an hour in a room illuminated with a dark red light, after which they should be put in a totally dark room measuring 2 x 1.5 x 2m, where they should remain for a further 10 minutes in total darkness until the measurement starts. This eliminates any ‘secondary luminescence’ of the cutaneous covering following radiation by the sun or artificial light. The measurement process itself takes up to 45 minutes [Edwards et al., 1989]. So the process of measuring spontaneous photo-emission is very complex and long. It needs to be measured with a special and unique device, and can be carried out only under specialised (specialized in USA) laboratory conditions.
The data obtained when measuring extremely weak ‘biophotons’ is invaluable scientific information, as they underline the role of the electro-photon processes in the functioning of the body. These scientific results are one of the scientific bases for the justification of the physical processes of GDV Bioelectrography.
In the GDV/EPC method, we excite, or stimulate electron and photon emissions, and then intensify the resulting glow a thousand times. This makes it possible to take measurements under normal circumstances, with normal lighting, without special preparation of the objects.
All the information in the GDV method is obtained thanks to computer processing of images and mass data. Without the methods of computer processing and specialized (specialized in USA) software, registering the glows of biological objects would be of no practical significance.
Therefore, GDV software is an integral part of the GDV system, and only by using GDV software is it possible to obtain complete information about the biological object carried by electrons and ‘biophotons’.
What does the GDV method measure in biophysical terms?
GDV measures the stimulated optoelectronic emission of a biological object. During the measurement process, an electric current flows through the circuitry of the GDV device. Thanks to the construction of the device, the current is a pulse current and is very small – micro amps. This is why the current causes no substantive physiological effects and is totally safe for the human body. But what kind of current is this in biophysical terms?
An electric current can be dependent on the conveyance of electrons or ions. When voltage pulses lasting longer than a few milliseconds are transmitted to the cutaneous covering, tissue depolarization takes place and ions are conveyed. This is why a number of electro-physical methods, such as electroencephalography or electro-acupuncture experience tissue polarization due to overlapping of electrodes, and poses a major problem that is resolved by using special pastes or gels. The GDV method uses short pulses, so depolarization does not occur and ionic currents are not stimulated.
Where does the electronic current in the body come from?
Let us look at the time curve of change in the surface area of the GDV signal of the cutaneous covering (Fig. 1.1). A typical curve initially falls, and shortly after the beginning of the measurement it stays at a relatively stable level, with occasional fluctuations.
There are two phases in this process. The initial stage is the extraction of electrons located in the outer layers of the cutaneous covering and the surrounding tissue. The number of these electrons is limited, which is why the current constantly decreases.
In the second phase, electrons from the deepest tissues in the body are included in the current flow. These electrons have several sources.
Some of these belong to the molecular albuminous systems, and in accordance with the laws of quantum mechanics, these electrons are dispersed among all the molecules. It is as if they are ‘collectivized’ between groups of molecules, so in principle it is impossible to say where an electron is at a given time. They form a so called ‘electron cloud’, occupying a specific area in space. We can see similar clouds in the blue July sky, and when a drop of rain falls on you, you can never tell from which part of the cloud the drop fell.
So the electron current in biological tissues is a transfer of electron-stimulated states along chains of albuminous molecules [Rubin, 1999].
Other sources of electrons in GDV processes are free radicals which form in the blood and tissues. There is a widely-held view that free radicals are the worst enemy of health, and that they should be fought in every way possible. Yet the body converts 70% of inhaled oxygen into free radicals so as to get rid of them straight away. Why is this process necessary? Over millions of years of evolution, could nature not have managed to change a mechanism harmful to health? Clearly, since the process of formation of free radicals was retained, it is necessary for biological functioning. Indeed, as has been demonstrated recently, free radicals are one of the sources of electrons and during free radical reactions, energy is transferred and converted [Voeikov et al., 2003]. Consequently, blood is one of the main substrata of the electron current.
If we look again at Fig. 1.1, we can see that, in the second phase, with the establishment of a quasi-stable current, mechanisms for the transfer of electrons along the albuminous molecules (mainly of the connective tissue) , and along the circulatory system, are engaged. In other words, the ‘electron storehouse’ of the body is engaged.
When the body is functioning normally, electron clouds are distributed among all systems and organs. Active transfer of oxygen to the blood takes place and all tissue consumes oxygen, using it in a cascade of biochemical conversions. One of the main consumers of these processes is the mitochondrion, which uses electrons to convert ATP energy molecules. In this case, the active transfer of electrons to the tissue is ensured, as is the free radical mechanism of transferring electrons to the blood, which is evident in the quasi-stable current during GDV stimulation.
In cases of imbalances and dysfunctions, immunodeficiency, or an abnormality of the micro capillary blood circulation, the transfer of electrons to the tissue is hindered. Free radical reactions do not flow in full volume, the ‘electron storehouse’ of the body is not full, and the stimulated current is either very small or is very irregular in time. Fig. 1.2 shows a dynamic curve for the patient. As is clear when comparing Figures 1.1 and 1.2 the patient’s dynamic curve has a very small amplitude and high variability.
Therefore, the lack of glow on the GDV-gram is an indicator of the impeded transfer of electron density to the body’s tissues, and an abnormality in the flow of free radical reactions. In other words, this is an indicator of an abnormality in the energy supply of organs and systems.
It now makes sense to get to grips (come to grips in USA) with the concept of energy itself, and how this concept is linked to the body’s state.
What does the GDV method measure in physiological terms?
The working of all the organs and systems is regulated by the central nervous system (CNS) and the autonomous nervous system (ANS).
It is possible to draw a similarity between the working of the body and the playing of a symphony orchestra. The finest movements of dozens of people in the orchestra are in total harmony; they are following the same part and respond sensitively to the tiniest direction from the conductor. You could single out the viola or oboe part, and they would sound like part of one beautiful melody.
It is the same in the body: each organ and each system plays its role, but they are all following one rhythm, one autonomous control.
But then one of the violins loses the rhythm, falling out of time with the overall control system. This goes unnoticed by the untrained ear, and only an experienced listener will hear the wrong note. The melody will sound, but the greater the number of instruments which fall out of line with the control system, the stronger and more noticeable the dissonance will be, until finally even the most uneducated listener will start to wince and slowly creep out of the hall.
This analogy can be applied to the working of the body. As long as all systems and organs are working in harmony, in unison, following the same program, the body is at its optimal functioning level. Control and direction are ensured by two fundamental mechanisms:
– Autonomous control by the nervous system (ANS), including neurohumoral regulation of activity;
– Electron control through active forms of oxygen in the blood.
It could be said that this control is the base level, making it possible to detect all external impacts and react to them instantly, supporting Homeostasis and the relative constancy of the body’s internal environment.
If a person runs about and makes a few sudden movements, and the ANS increases the frequency of the heart’s contractions, then breathing speeds up, increasing perspiration. More oxygen gets into the blood, and this oxygen is more actively conveyed to the tissues, with some of the by-products of the decline coming out through the skin.
The reaction takes places almost instantaneously, and the whole body, all its systems and organs, are engaged by this reaction. This is evidence that all the organs and systems are working in a synchronised (synchronized in USA) way under the control of a single commanding system. Everything happens as in a well-tuned orchestra.
When autonomous regulation fails and that synchronicity is lost, the organs and systems stop working in harmony and functional abnormalities appear. In the first phases, these abnormalities appear as a bad state of health, disturbed sleep and digestion, and abnormalities with perspiration and so on. Continued dysfunction leads to abnormalities at the level of the organs, though the area of abnormality depends on the type of load and genetic predisposition.
This rather simplified diagram of Fig.1.3 shows the general character of the body’s reactions and the development of diseases.
Reacting to commands coming from the CNS and the surrounding environment, the ANS and blood send information control signals to the body’s systems and organs. These signals are ‘processed’ both at the physiological level of systems and by engaging the endocrine and immune systems. Information is transferred to the controlling organs, forming a Biological Reverse System (BRS). In this way, a closed circuit of control is formed. When there is an abnormality in any one of the information links, the circuit fails and de-synchronization occurs, reflected in the functional abnormalities at all of the most vital levels.
Therefore, the autonomous nervous system enters into the first circuit of control, and all the potential problems appear mainly at the level of ANS activity.
There is much experimental data which proves that the GDV method measures the activity of the autonomous nervous system. This is proved by statistically significant correlations with the results of the measurements of the variability of cardiac rhythm [Cioca et al., 2004], of systolic and diasystolic pressure [Alexandrova et al, 2004], perspiration through the skin [Rizzo-Roberts, 2004], and the stress level [Bundzen et al, 2002]. The findings about the link between GDV data and ANS activity were first made during work [Drozdov, Schatsillo, 2005] and subsequent results confirmed these findings.
There is every justification for affirming that the parameters of GDV images reflect the activity of the autonomous nervous system and the balance of sympathetic and parasympathetic sections of this system.
What is the sensitivity of the GDV method based on?
The autonomous nervous system is the main indicator of the body’s reaction to external and internal impacts – from changes in the weather, chemicals in food and the efficiency of oxygen absorption to emotional worries. All of these processes are processed by the sympathetic and parasympathetic nervous system and are reflected on the parameters of the cutaneous covering. The electrical resistance of the skin changes, both as a whole and at electro-puncture points, the capillaries narrow and widen, and there is an emission of organic molecules through the pores; the nature of the transfer of electrons to the connective tissues also changes. All of these processes influence the emission of electrons from the skin and the development of electron avalanches, which is reflected in the parameters of the GDV-gram.
Many years of research into the physics and biophysics of the visualization processes have made it possible to discern optimal conditions for the development of all processes, which made it possible to obtain sensitive but well-reproduced GDV images.
See also: Kirlian, Kirlian Photography, BIO-WELL HISTORY, Bio-Well Community
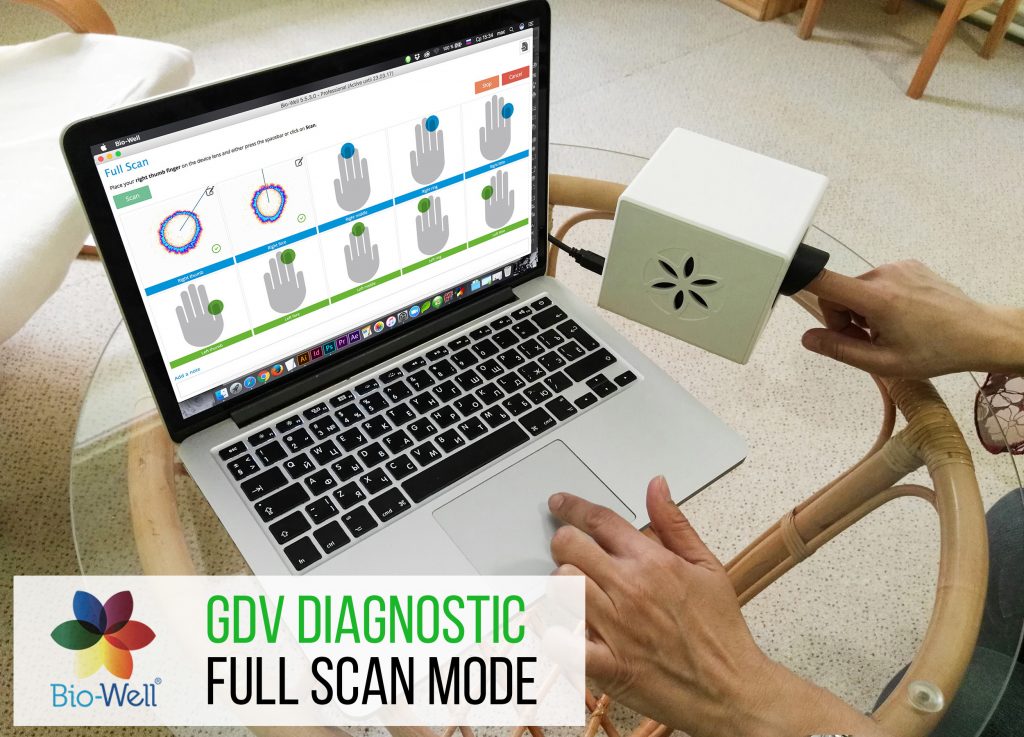
The Bio-Well Device
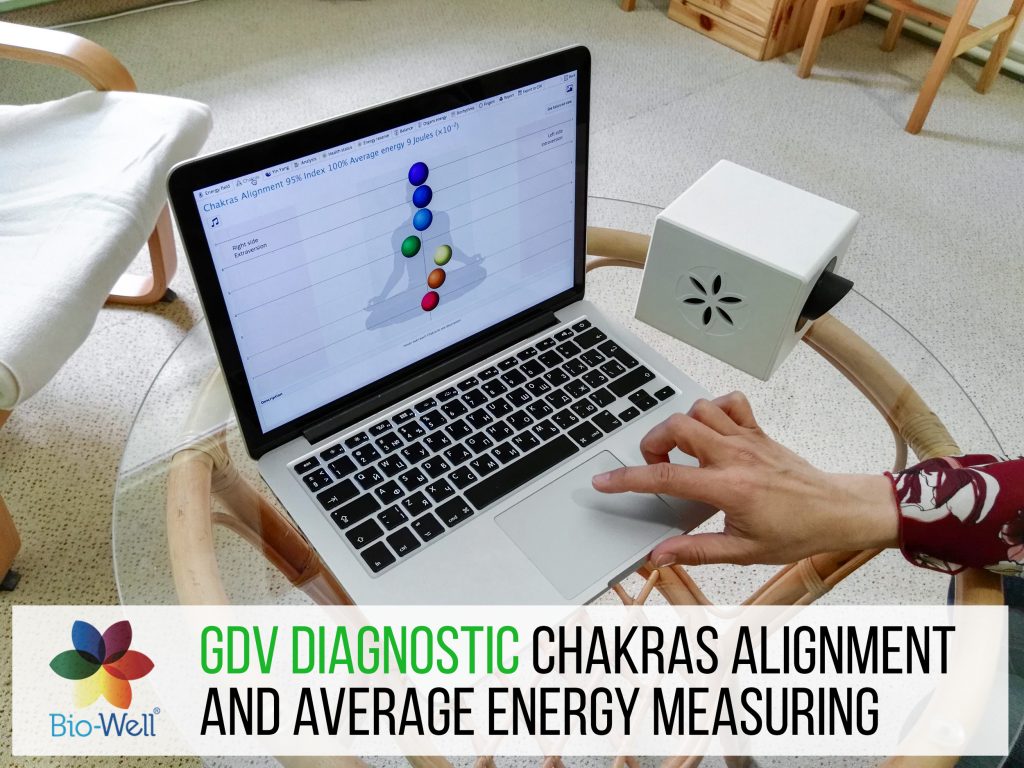
The Bio-Well device uses GDV or Gas Discharge Visualization, also known as the Kirlian effect, to measure and analyze electro-photonic emissions of the human fingers. When a scan is conducted, a weak electrical current is applied to the fingertips for less than a millisecond. The skin’s response to this stimulus is the formation of a variation of an “electron cloud” composed of light energy photons. The electronic “glow” of this discharge, which is invisible to the human eye, is captured by the camera system and then transmitted and translated back in graphical representations to show energy, stress and vitality evaluations. Bio-Well illustrates the overall state of a person’s energy field. The images created using the Bio-Well system are based on Traditional Chinese Medicine. The data from each test is converted to a unique “photonic profile”, which is compared to the database of hundreds of thousands of data records using 55 distinct parametric discriminates, and charted and displayed for discussion and analysis.
GDV/EPI Research Forum KOROTKOV.info:
Human Light System
Bioelectrography History
Research of human body activity after death
IUMAB and Bioelectrography publications
Hi!!!
This is really interesting stuff. I was just thinking that one of the most straight forward ways of actually collecting a databank of these reactions in humans coupled with surveys of peoples health, financial situation etc. could be done by using sensory deprivation tanks.
Think about it. The tanks are by nature dark anyway so that takes care of a major issue right there. The sensory deprivation could actually inspire some really strange psychic states that could then be observed via GDV. The data could be recorded and then all you need to do is look for a statistical correlation between colors, shapes etc. in the pictures and the data provided in the surveys.
And the sweet part is that even tough it would be an ongoing investigation there are some people who would pay good money to participate. You know, the types searching for some kind of a new-age treatment or diagnosis. As the sensory deprivation tanks are already a hit in that market I have no doubt in my mind that people wouldn’t buy in to this, big time. Yeah, I know. It’s about science first, not money. But this is actually the most direct way to collect the data and there is absolutely no harm done.
OK, the idea is free to use by your decision but if you do use it I would like to be hinted. And possibly tested.
Dear friends!
GDVCAMERA BIO-WELL
Gas Discharge Visualization Technologies, GDVCAMERA by Dr. Korotkov
http://korotkov.info/index.php?/forum/9-gdvcamera-bio-well/
WELCOME!
GDV, EPC, EPI, Kirlian photography, Dr. Korotkov techniques, Crownscopy, etc.
Hiii
This is a very interesting stuff but I have some trouble while reading this. I didn’t get the figure as mentioned in
“Let us look at the time curve of change in the surface area of the GDV signal of the cutaneous covering (Fig. 1.1)”
also all other figure.
help me plzz…
Welcome to GDV Diagnostics video course with Dr. Dvoryanchikov & GDVCAMERA Bio-Well Course on English! You can see it 24/7. More than 100 hours of video content about GDV technologies
Hi,
I want to know price for this product.
Dr. Lee L.Ac. PhD
Dear Dr. Lee, please see Bio-Well price-list here.