Interpretation of Korotkov images
Interpretation of Korotkov’s images By Dr. Dvoryanchikov (GDV grams, Bio-Well scans, etc) Interpretation of Korotkov’s images
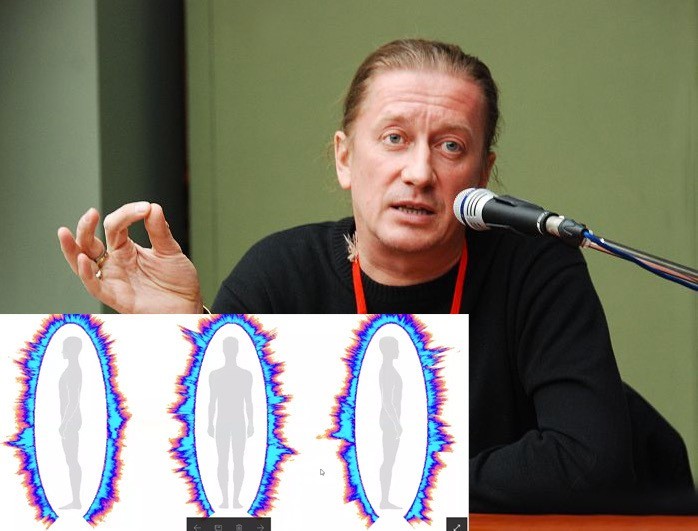
Gas Discharge Visualization techniques by Dr. Korotkov
Korotkov’s images – BEO gram, GDV images, EPI images, Bio-Well images, etc
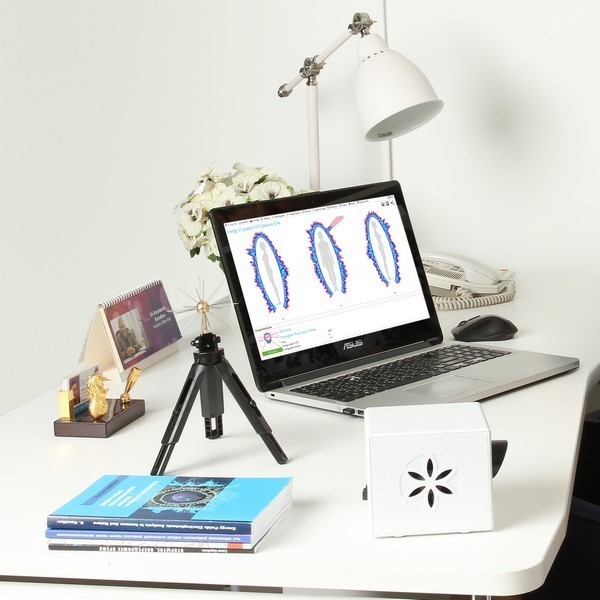
Korotkov’s images – Kirlian images downloaded and processed on GDV Software
Digital Kirlian Photography
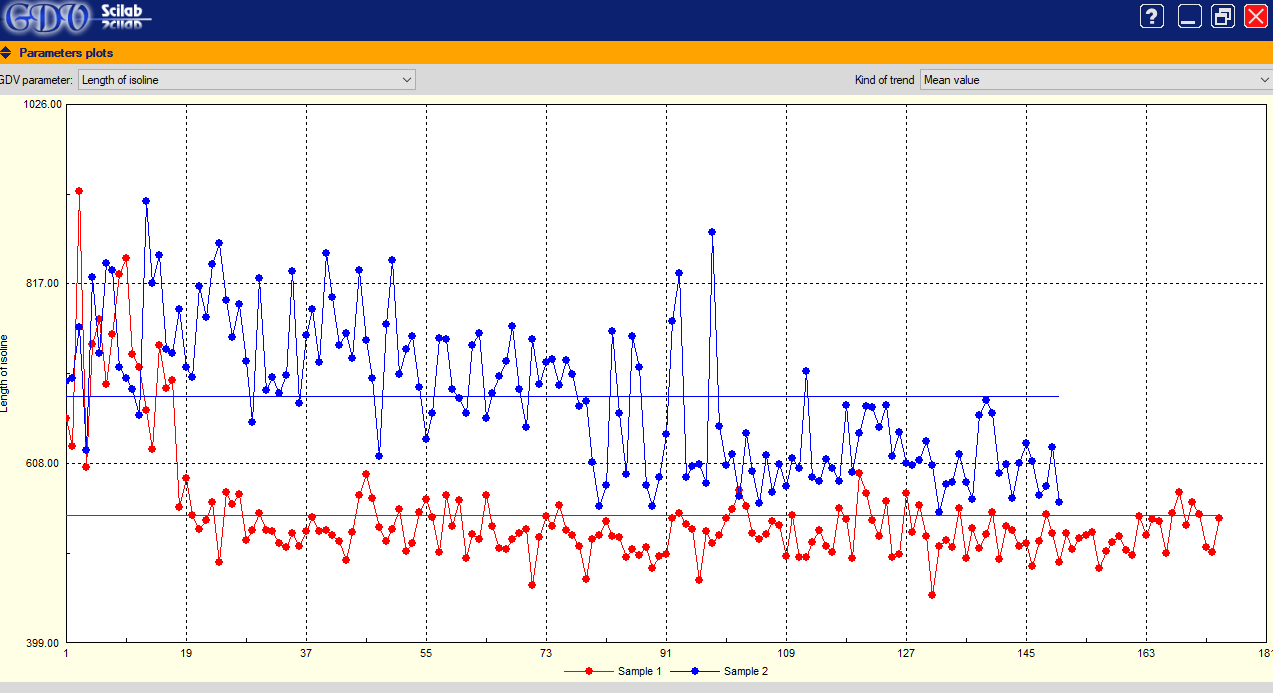
Korotkov image is a complex 2-D figure with each pixel characterized by its brightness coded by integer in the range of 0 (“black”) to 255 (“white”). Geometrical parameters of GDV-images (e.g., the area defined as a sum of pixels exceeding the specified brightness threshold; fractality coefficient defined as relation of the length of the image perimeter to its average radius multiplied by 2Pi, the breadth of streamers) contain the information about the object’s characteristics. For example, with an increase of ion concentration in liquid the glow increases while the streamer breadth decreases. To include such data into the structure of a complex biophysical experiment quantitative processing of the obtained images is required.
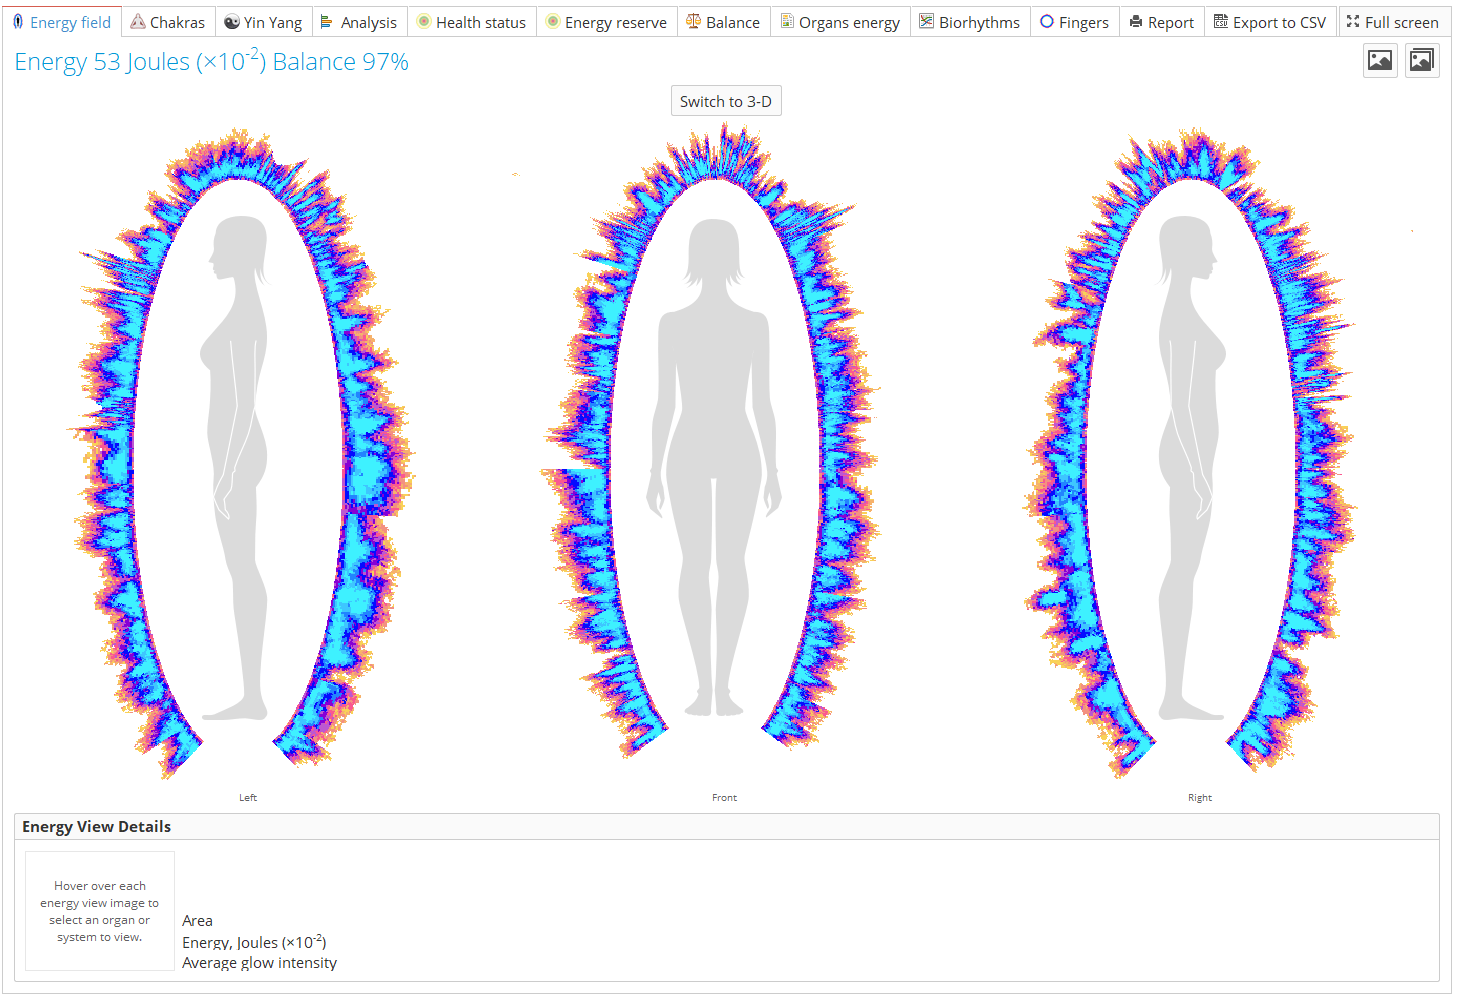
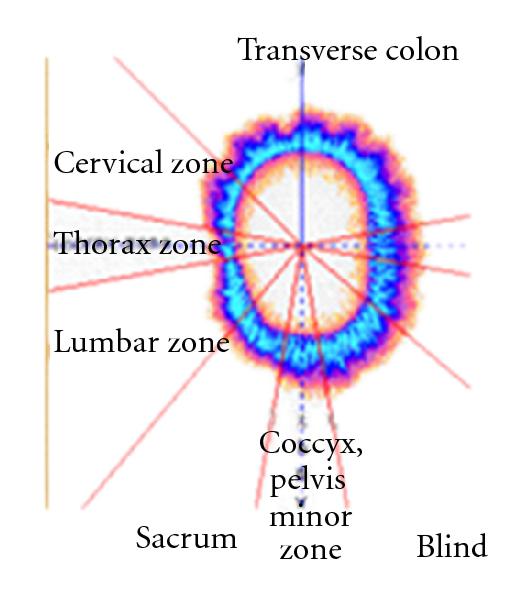
GDV chart
GDV Diagnosis Chart, GDV Maps, GDV Tables
Interpretation of Korotkov’s images By Dr. Dvoryanchikov (GDV grams, Bio-Well scans, etc) Interpretation of Korotkov’s images
Basics of sensing the human energy by Karen O’Dell Human Light System Course HLS 2.0 Course Lecture 23 by Karen O’Dell Basics of sensing the human energy Welcome to another lecture conducted by Karen O’Dell who is a Healing Touch Certified Practitioner (HTCP). The topic for this lecture is, the basics of sensing the human … Read more
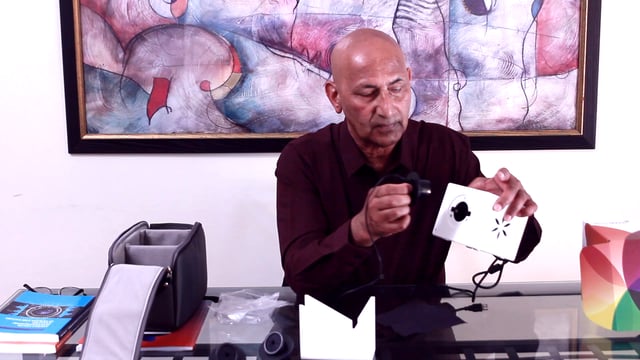
Power of Inner Peace – Be the Vibrant Light by Dr. Krishna Madappa Human Light System Course HLS 2.0 Course https://www.humanlightsystem.com/course/ Lecture 46 by Dr. Krishna Madappa Power of Inner Peace – Be the Vibrant Light ABOUT DR. KRISHNA MADAPPA Spiritual Scientist International Researcher & Educator GDV/Bio-Well -Light, Life, Wellness Analysis Dr. Krishna Madappa, President … Read more
Lecture about GDV Bio-Well HLS Course 1.0 HLS 1.0, Lecture 4 about GDVCAMERA Bio-Well GDVCAMERA Bio-Well https://gdvcamera.com/ Human light System – how GDV works? https://www.humanlightsystem.com “General manager”, “Dr.” Dmitry (Mitya) Orlov about GDVCAMERA Bio-Well UPD2020 Bio-Net Server/beta available https://korotkov.co/ GDVCAMERA Bio-Net by KOROTKOV company will be available soon https://korotkov.com/ Light and Love! See also: Bio-Well … Read more
Human Light System Course for Free on YouTube Entropyn technology – next level of the Bioelectrography Research GDVPLANET YouTube channel – experimental audio-video channel using Entropyn by KOROTKOV company Entropyn TV GDVCAMERA by DrK Study, Advanced Level GDV Bio-Well Tutorials and Training The Energy of Space Bio-Well Calibration
GDVCAMERA by DrK Forums using Entropyn technology GDV, Kirlian, Bioelectrography GDV, Kirlian, Bioelectrography Research GDVCAMERA by DrK Forums GDVCAMERA by Dr. Korotkov Korotkov’s images GDV/EPI training GDV Library GDV Sputnik About GDVCAMERA Bio-Well Korotkov Web Archive
Entropyn technology – update Korotkov’s images Entropyn Attention manager and Anti-Stress service Zoom Entropyn – service for enhancement of online meetings held on Zoom, YouTube, Twitch, Facebook, Instagram etc Web Entropyn – service for enhancement of web resources Entropyn technology Attention manager and Anti-Stress service for enhancement of online meetings held on Zoom, YouTube, Twitch, … Read more
Bio-Net Server/beta available Free Uploads – Welcome to the Bio-Net! Bio-Net Services – What can you do on the Bio-Net Server Connect device to the Bio-Net server – update your business Entropyn TV – First healing TV Sapiens Transitos – every Monday Forums, Clubs
Human Light System Course 1-3 For Free on Korotkov.TV online – First Bio-Net Healing TV Experimental 5 years online course about Human Energy Field. More about HLS Course here
Bioelectrography News 2020 April GDV developments, research and innovations Gas discharge visualization – historical developments, research dynamics and innovative applications Denitsa Grozdeva1,2 , Tsanka Dikova3 1Department of Conservative Dental Treatment and Oral Pathology, Faculty of Dental Medicine, Medical University of Varna 2University Centre of Eastern Medicine, Medical University of Varna 3Department of Dental Material Science … Read more