
Enhance Your Zoom!
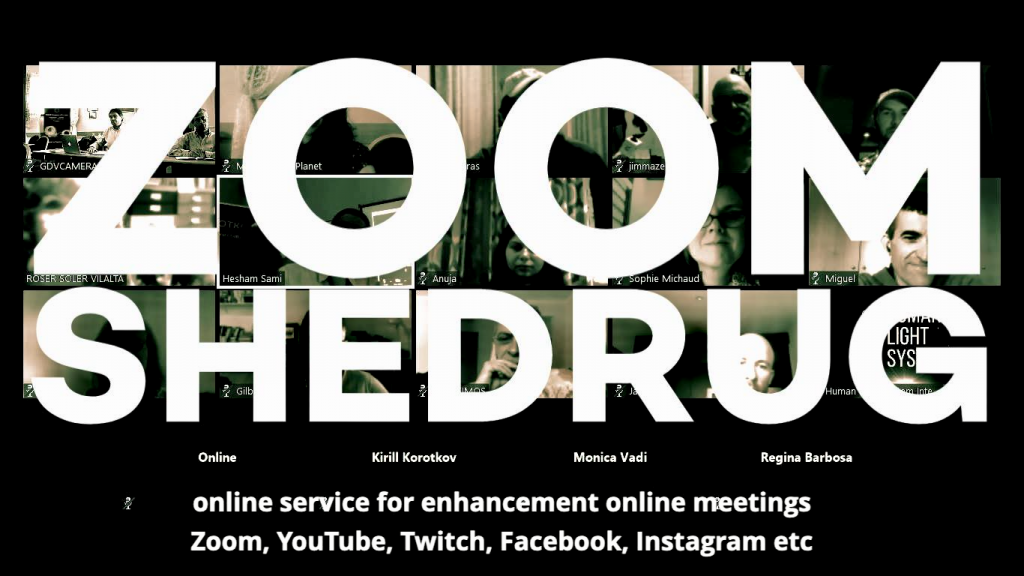
Zoom Shedrug Service
Zoom Shedrug – service for enhancement online meetings Zoom, YouTube, Twitch, Facebook, Instagram etc
Zoom – to move very quickly
Shedrug (Hebrew) – the process of improving the quality
Before Zoom Shedrug:
Zoom Shedrug – enhancement of online meeting
Contemporary technologies To Day, To Month, To Year and For Ever
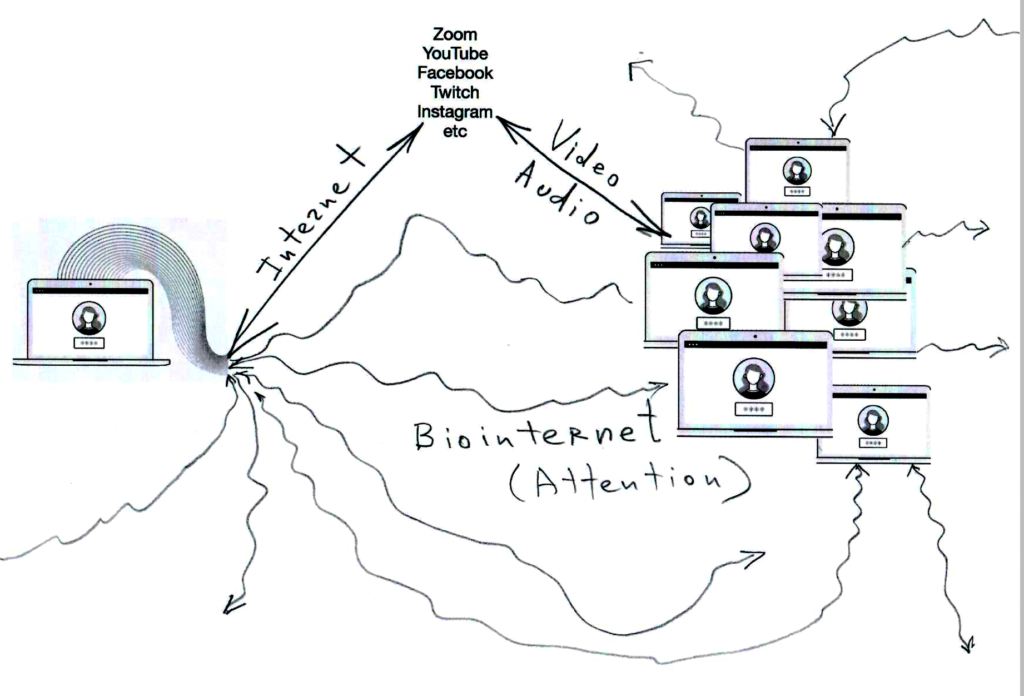
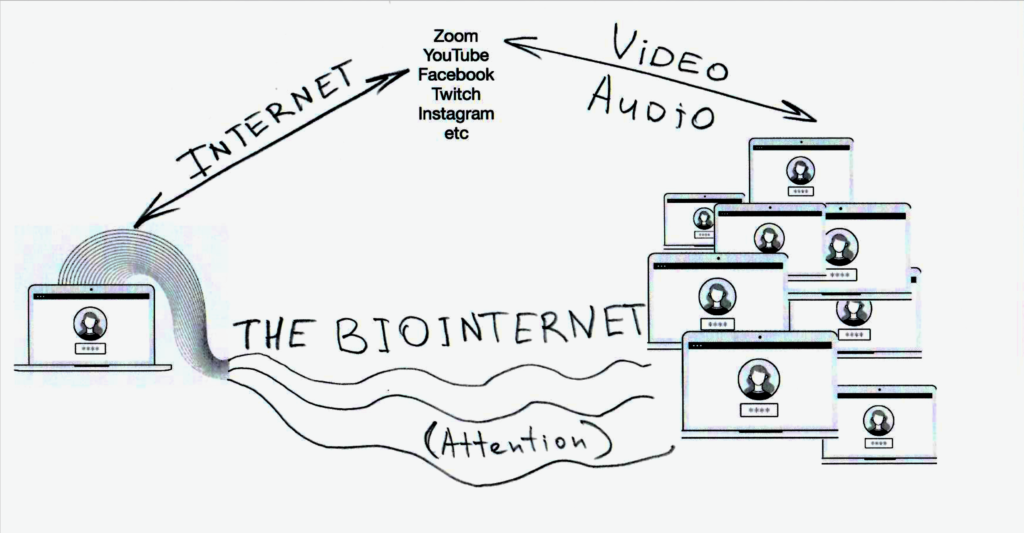
When you download meeting’s link to the Biointernet:
Zoom Shedrug Meeting:
The Bio Internet Revolution 2020!!!
What you and participants can feel: meeting become more user friendly, cosy and comfortable
Zoom Shedrug – service for enhancement of online meetings (Zoom, YouTube, Twitch, Facebook, Instagram etc)
What you can measure: GDVCAMERA by DrK and GDV Sputnik, other available sensors
Zoom Shedrug tested on GDVCAMERA by DrK and GDV Sputnik
See more
Zoom Shedrug tested on GDVCAMERA by DrK and GDV Sputnik
GDV Sputnik measurements
We made experiment with GDVCAMERA by DrK and GDV Sputnik.
Zoom Shedrug – service for enhancement online meetings Zoom, YouTube, Twitch, Facebook, Instagram etc
To illustrate the operability of the proposed technology, a series of experiments was carried out to attach Translighters structures to the Zoom program link.
As a result of this connection, links of the ZOOM program connect with Bio-Net.
In this case, in addition to the usual visual information, a stream of the Bio-Net ordering physical structures begins to pass through the computer monitor.
This stream changes the characteristics of the space in front of the monitor that can be measured.
As a means of control, GDVCAMERA by DrK and GDV Sputnik sensor was used. The GDV Sputnik was installed in front of the laptop monitor. The GDV signal integrally depends on the radiation flux in the room. The sensor is connected to the test object of the Bio-Well device. The test object forms a light spot of Kirlian radiation on the glass of the device, which captures the video camera of the device and transfers it to the computer. (More about GDVCAMERA by DrK and GDV Sputnik).
In automatic mode, measurements were made of the glow of the test object with an interval of 10 seconds. Each series – 150-2020 measurements. Next, a series of measurements was processed using the statistical processing program GDV SciLab (more about GDV Software). 10 main parameters characterizing the Kirlianogram were calculated (more about Korotkov’s images).
Measurements were taken before connecting the Zoom link to the Bio-Net structures and after joining the structures. Some measurement results are shown in the graphs below.
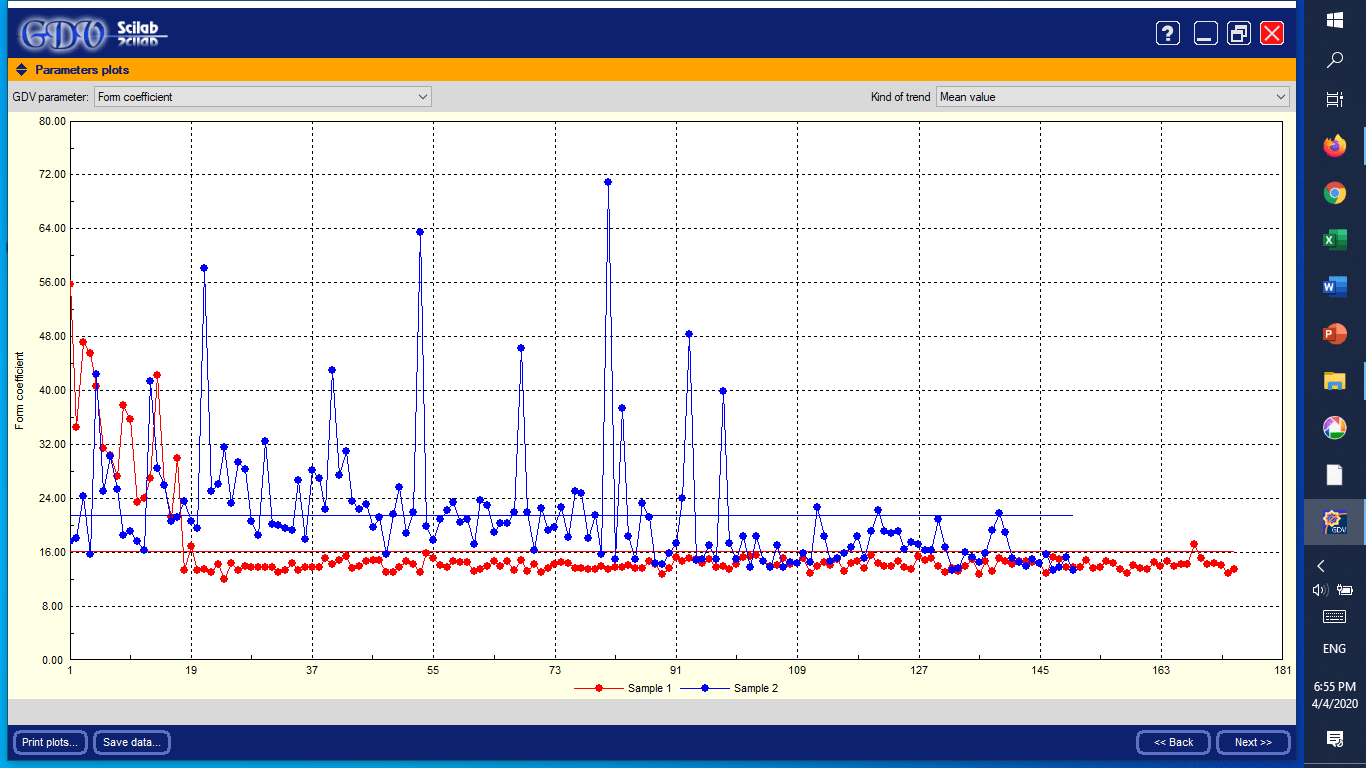
Measurement of structural interactions using the GDV Sputnik sensor
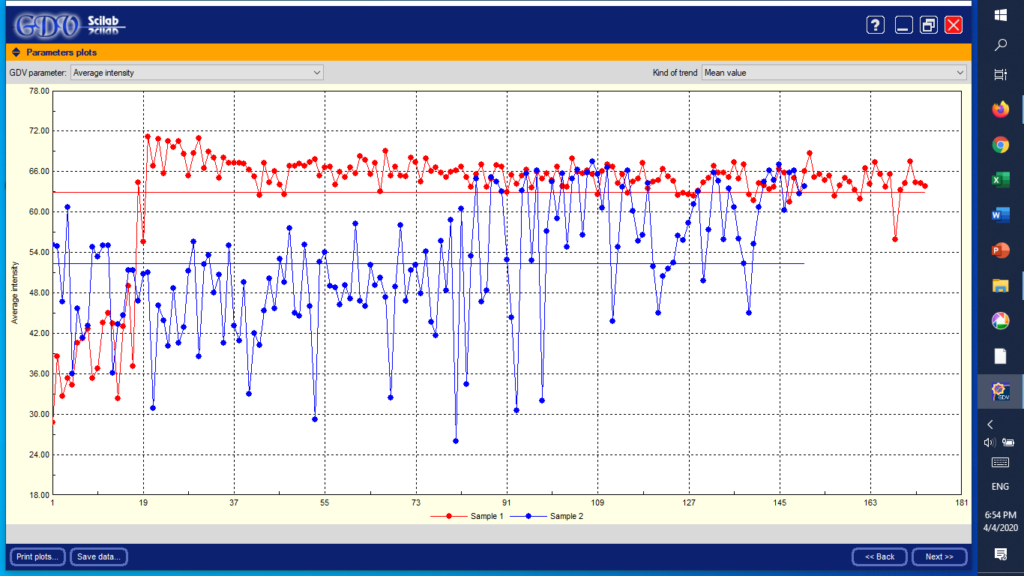
Fig. 1 Graph of changes in average radiation intensity. Sample 2 – before connecting Bio-Net structures, Sample 1 – after joining structures
A important characteristic feature of this graph is the presence of a transition process at the beginning of the second sample and, then, stabilization of the process.
Pay attention to the significant spread in the values of the first sample (before) and a significant decrease in the spread in the second measurements. This indicates that the ordering of the flow happening (reduction of the chaos), using the Bio-Net connection.
Sample 2 – before connecting Bio-Net structures, Sample 1 – after joining structures
A measure of the unavailability of a system’s energy to do work; also a measure of disorder; the higher the entropy the greater the disorder. … In thermodynamics, a parameter representing the state of disorder of a system at the atomic, ionic, or molecular level; the greater the disorder the higher the entropy.
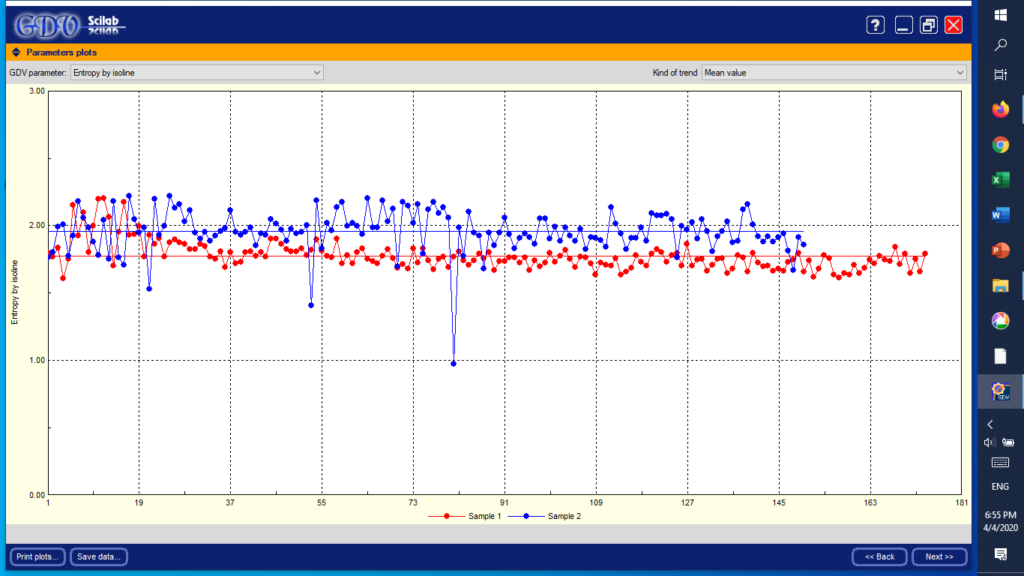
Fig. 3 Entropy by isoline. Sample 2 – before connecting Bio-Net structures, Sample 1 – after joining structures
The graph shows a decrease in the entropy level of the second sample. Entropy is a measure of disorder. This also confirms a decrease in the extent of chaos in the measured signal and an increase in Negentropy.
The difference in the indicators is statistically significant, which is clearly seen from the graphs of statistical data.
Negentropy is reverse entropy. It means things becoming more in order. By ‘order’ is meant organisation, structure and function: the opposite of randomness or chaos. … The opposite of entropy is negentropy.
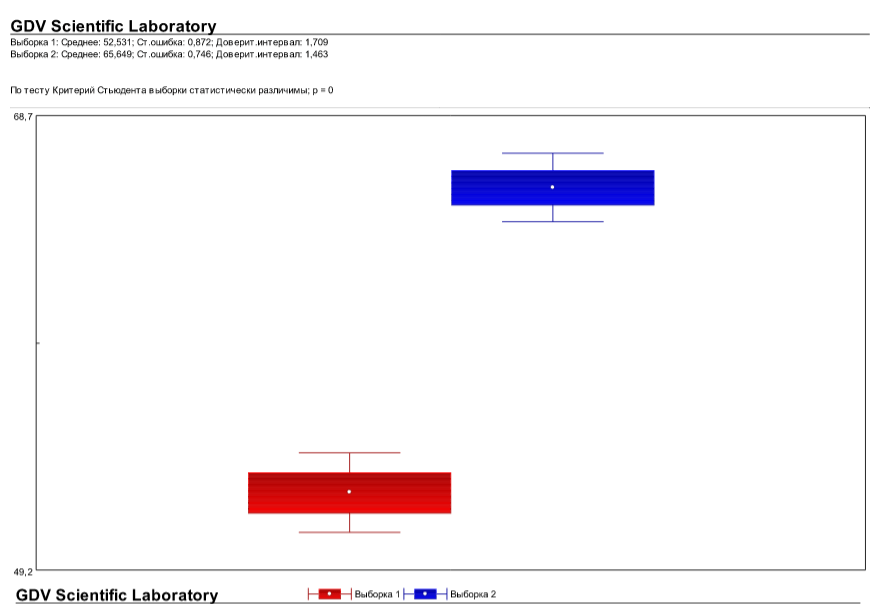
Fig. 4 Average, Standard Error and Confidence Interval of Korotkov’s images (radiation intensity).
Sample 1 before connecting Bio-Net structures, sample 2 – after joining Bio-Net structures to the Zoom link.
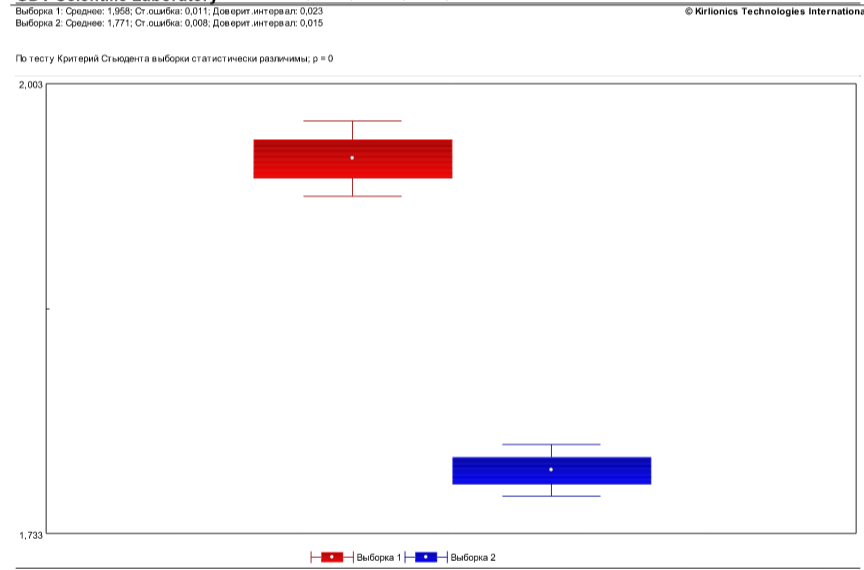
Fig. 5 Average value, standard error and confidence interval for the entropy indicator.
Sample 1 – before, Sample 2 – after connecting Bio-Net structures to Zoom link.
Figures 4 and 5 clearly show the statistical significance of the measured values by the student criterion test.
Samples are statistically distinguishable.
You can also see a decrease in the standard error of the measured signal by 20-30%.
This means that people interacting with the Bio-Net structures through a Zoom account will become more accurate in making decisions and will more effectively perceive the information transmitted to them online.
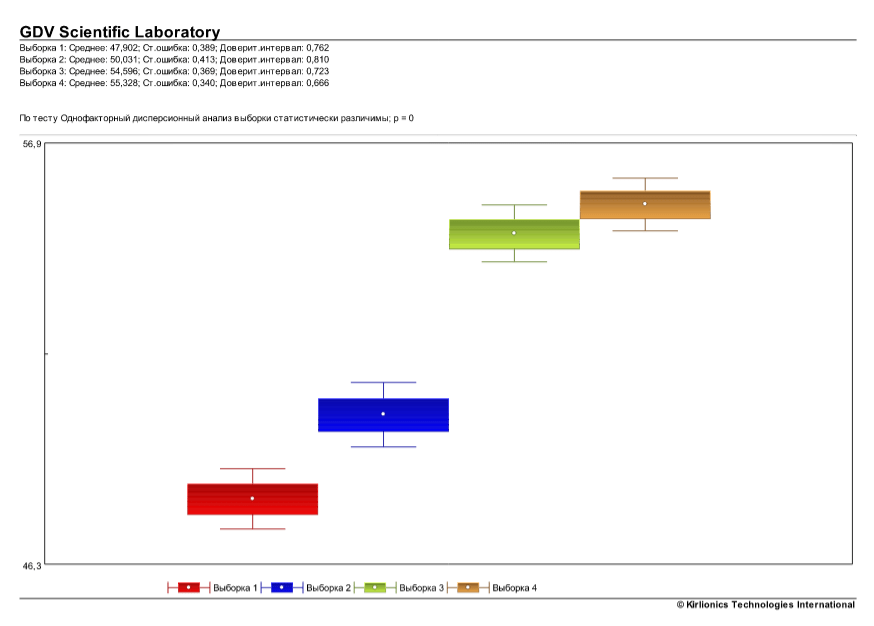
Fig. 6 Average value, standard error and confidence interval for an indicator of radiation intensity.
Sample 1, 2 before joining structures, sample 3,4 – after joining Bio-Net structures to the Zoom link.
To confirm the result of this experiment, measurements were taken in other rooms, with different initial parameters of environment (temperature, humidity, etc), and the time of day was also varied.
Each time a new Zoom link conference was used. In the graphs below you can see a significant change in the measured values after attaching the Zoom link to the Bio-Net physical structures.
The main changes (Zoom Shedrug) are as follows:
- increasing the energy of the space near the GDV Sputnik (increase in the area and brightness of Korotkov’s images);
- increasing the radiation isotropy (decrease in shape factor of Korotkov’s images);
- decreasing the entropy (increasing the measure of order, negentropy);
- reduction of the standard error for a number of parameters (improving the accuracy of measurements). The same effect we can see using Lad device.
Activate Zoom Shedrug Now!
1 Day no limits links – 19.80 EUR
1 Month no limits links – 498 EUR
1 Year no limits links – 4888 EUR
See also: Qualia and Time Sense, QQQ – Quality, Quantity, Qualia, Qualities and Quantities